Shoppable video in 2026: 7 best practices backed by data from 350+ brands
Shoppable video has moved beyond small-scale trials on a handful of product pages. Data now shows its impact on metrics directly linked to ecommerce performance: an average uplift of 3.8% in add-to-carts, 6.1% in conversion and 6.7% in revenue per visitor.
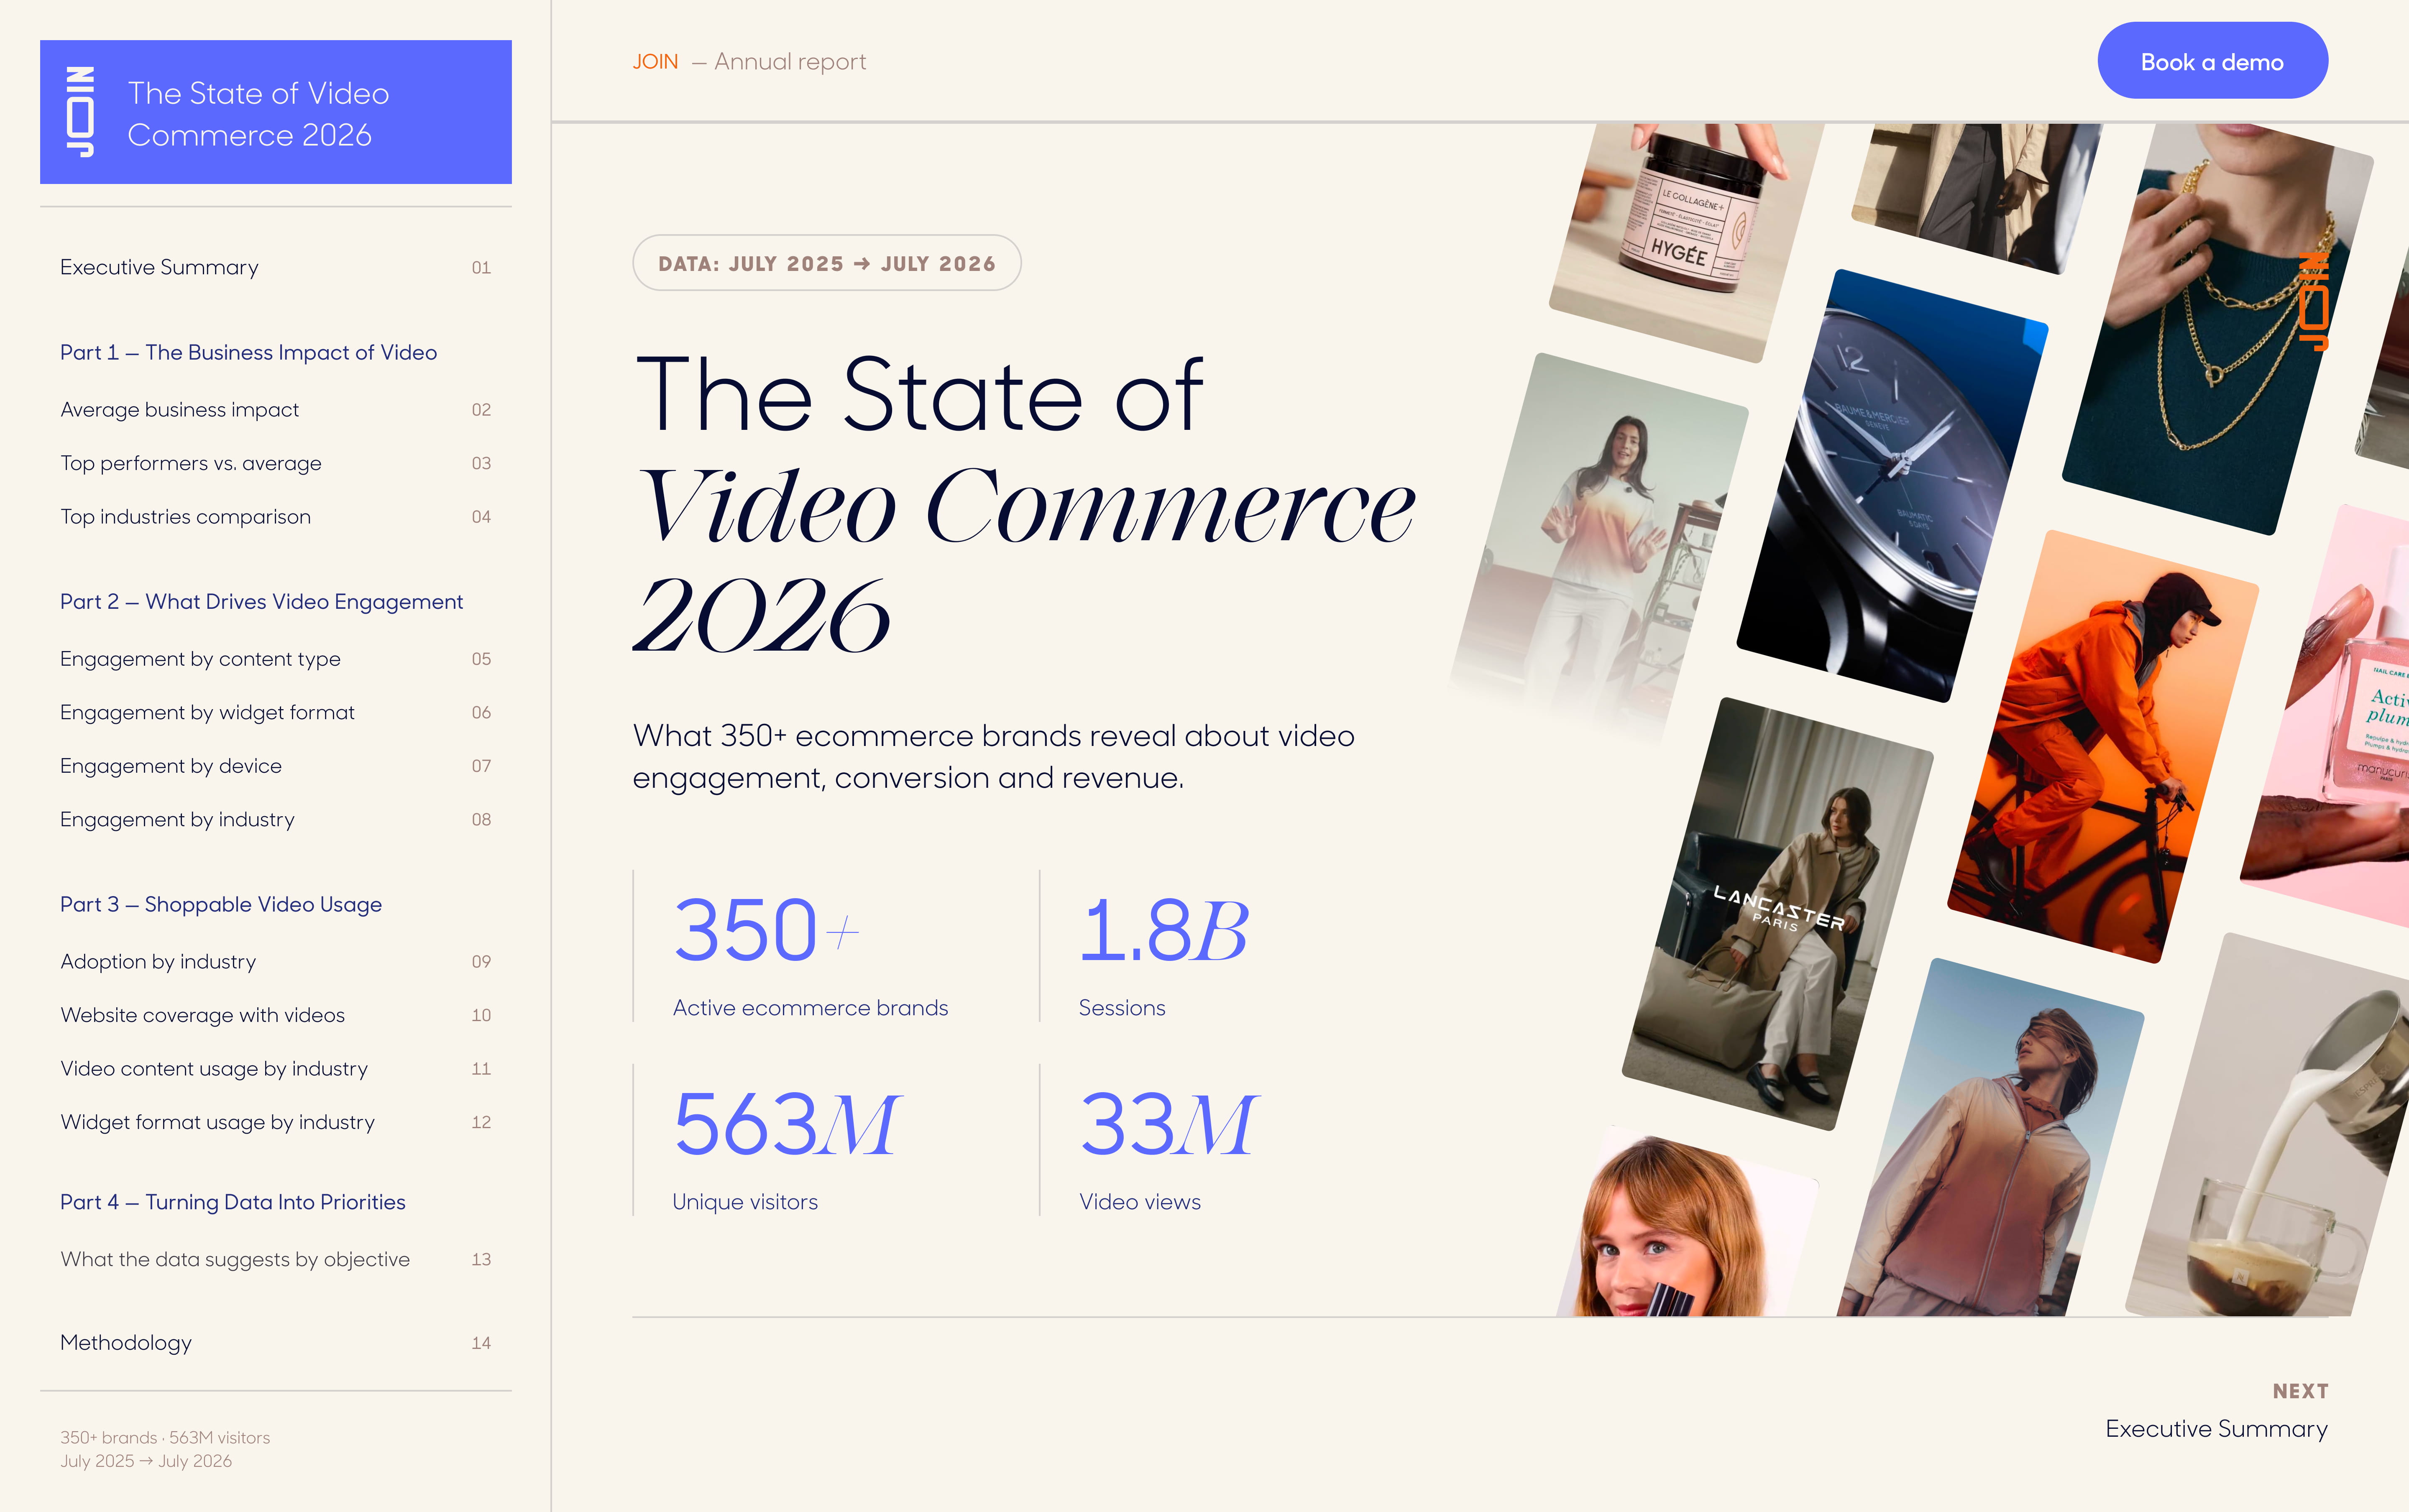
These findings come from JOIN’s State of Video Commerce 2026, which analyses video usage and performance across more than 350 ecommerce brands between July 2025 and July 2026.
The report also moves the conversation beyond “does video work?” to a more useful question: what sets the best-performing brands apart? Content, widget formats, mobile experience and site coverage all offer areas to explore.
Here are seven ecommerce video best practices drawn from the 2026 data.
1. Track the business impact of your videos
The first takeaway: shoppable video’s impact goes beyond views and engagement.
View counts help you understand how widely your videos are being watched, but they do not tell you enough about their impact on sales.
Across the tests analysed by JOIN, experiences featuring video delivered average increases of:
- 3.8% in add-to-carts
- 6.1% in conversion
- 6.7% in revenue per visitor
- 4.6% in session duration
In ecommerce, where a few percentage points of conversion can make a significant difference to revenue, these results make a case for measuring video alongside UX, merchandising and product page optimisation.
For a closer look, read our guide to the KPIs to track when measuring shoppable video performance.
💡 Put it into practice: Track the impact of your videos on add-to-carts, conversion and revenue per visitor from the start. Where possible, run an A/B test comparing experiences with and without video to isolate its effect.
2. Use performance data to refine your shoppable video strategy
Not every brand gets the same value from shoppable video.
The top 10% of performers in the report achieve a 17.7% increase in conversion, compared with an average of 6.1%. For revenue per visitor, the figures are 21.0% versus 6.7% on average. The highest observed RPV uplift reaches 51.3%.
These differences point to considerable room for improvement after the first videos go live. Content, widget format, placement and site coverage are all variables you can adjust as you learn what works.
💡 Put it into practice: Start with an initial setup, measure its performance and refine individual elements over time. Treat your video setup as something to keep improving.
3. Choose the right video content for your goals
Tutorials, user-generated content (UGC) and product demos each play a different role in how shoppers engage with video.
→ Tutorials lead on JOIN’s completion metric, at 61.2%, and have the longest average watch time: 25.5 seconds. They are particularly useful for products that need an explanation or demonstration.
→ UGC scores 59.8% on the completion metric, with a shorter average watch time of 15.9 seconds. It can show products in real-life settings and provide social proof.
→ Product demos account for 30% of recorded video views. They offer a quick way to show a product, how it looks or its key features.
The data does not identify one content type that performs best in every situation. The right choice depends on what the video needs to do at that stage of the buying journey.
💡 Put it into practice: Use tutorials to explain products, UGC to build confidence and help shoppers picture themselves using them, and demos to show products in action at a glance.
4. Improve video visibility with the right widget format
Even a great video will have little impact if nobody sees it.
The Solo-sticky format achieves 89.9% viewability, the highest level recorded in the report. By remaining visible as visitors scroll, it gives them more opportunities to notice the content.
Visibility is only part of the picture. The report also shows substantial differences in click-through rates between brands: the top 10% of performers achieve a CTR of 7.1%, compared with an average of 2.4%.
Sticky widgets do not need to replace every other format. The right choice also depends on the page and the stage of the journey: product pages, category pages and homepages serve different purposes.
💡 Put it into practice: If visibility is your priority, test Solo-sticky, which has the highest viewability in JOIN’s data. On category pages, try the list-bubble format to showcase more content and products.
5. Optimise your shoppable videos for mobile
Ecommerce video is predominantly mobile-first.
According to JOIN’s State of Video Commerce 2026, 77.3% of widget impressions and 73.3% of video views take place on mobile.
That makes it essential to design for smaller screens from the outset. Use suitable vertical formats (9:16), keep text and CTAs easy to read, and make sure videos work without sound.
What happens after someone watches matters just as much. A hard-to-reach button or a widget that obscures part of the interface can quickly undermine the value of the content.
💡 Put it into practice: Always test both the video and the widget on a smartphone. Check the framing, readability and the full journey through to adding a product to the cart.
6. Expand video coverage across your product catalogue
Top-performing brands tend to have broader video coverage across their sites.
Among the top 10% of performers, pages featuring video account for 59.5% of traffic, compared with 29.3% on average.
In other words, the best-performing brands give video a presence beyond a few isolated pages, bringing it to a much larger share of their traffic.
The data therefore suggests that, as a video strategy develops, it gradually reaches a greater proportion of site traffic.
Scaling up also means producing and managing more content. Repurposing UGC and social content, along with AI-assisted creation, can help make that production scalable.
💡 Put it into practice: Start with your highest-traffic product pages, then expand gradually so that a growing share of visitors encounter video.
7. Tailor your video strategy to your industry
Video usage varies considerably by category. In beauty, product demos account for 34% of views, ahead of UGC (27%) and tutorials (25%). In sport, UGC leads with 52% of views, while tutorials take the largest share in wellness, at 38%.
These differences show that there is no single content mix for every sector.
They reflect different patterns of video usage across product categories and provide a starting point for building your own content playbook.
💡 Put it into practice: Take inspiration from the patterns in your sector, then test what works best for your own visitors.
Ecommerce video best practices for 2026: test, measure and expand
The findings in JOIN’s State of Video Commerce 2026 point to a few straightforward principles:
- Start with a clear goal and choose your content and format accordingly.
- Measure the impact on business KPIs.
- Design for mobile from the outset.
- Test different content, formats and placements.
- Bring what works to a growing share of your traffic.
- Tailor your approach to your sector.
The best-performing brands build their video strategy over time, using their own results to guide each step.
If you are getting started, our comparison of the best shoppable video platforms can also help you find a solution that fits your tech stack and goals.
Shoppable video best practices: FAQ
What is shoppable video, and how does it differ from a standard product video?
Shoppable video connects the content directly to the products featured, allowing visitors to continue shopping from within the video experience—for example, by opening a product page or adding an item to their cart. A standard product video generally offers viewing only.
What are the best practices for adding shoppable video to a product page?
Place the video close enough to the elements that inform a purchase decision for shoppers to notice it. Choose content that answers a real question about the product, and design for mobile first. Then test different placements and formats, using more than view counts alone to judge performance.
Which video content should ecommerce brands prioritise: UGC, tutorials or demos?
No single content type consistently converts best in every situation. In JOIN’s data, tutorials lead on the completion metric (61.2%), followed by UGC (59.8%), while product demos account for a substantial share of views. Choose content based on the role it needs to play in the buying journey.
How can I measure the impact of shoppable video on my conversion rate?
If your platform supports it, run an A/B test comparing an experience with video against one without. Then compare conversion, add-to-carts and revenue per visitor across the two groups. This provides a better way to isolate video’s actual impact than simply comparing people who watched a video with those who did not.
How many product pages should feature video?
There is no universal threshold. However, the report shows that top performers bring video to a much larger share of their traffic: 59.5%, compared with an average of 29.3%. Start with pages that receive enough traffic to measure results, then expand coverage gradually.
Does shoppable video work as well on mobile as on desktop?
Mobile accounts for most of the video activity observed by JOIN, including 73.3% of video views. It should therefore be the primary screen you design videos and widgets for, with a dedicated mobile experience considered from the start.
How can I tailor my ecommerce video strategy to my industry?
Start with your category benchmarks, then consider how shoppers use video in relation to your products. In JOIN’s data, for example, product demos account for a substantial share of views in beauty, while UGC is more prominent in sport. Use these benchmarks as a starting point, then let your own tests determine the best-performing content mix.
{{cta}}