Video Commerce: The 5 KPIs That Actually Predict Sales [2026 Benchmarks]
Your video has racked up 10,000 views. Great. But how many sales did it actually generate?
Views are an important measure of video reach, but they don't tell you much about business impact. If you want to know whether your content is actually driving ecommerce performance, you need to look at what happens after someone watches.
Completion rate, video CTR, add-to-cart rate, conversion lift and revenue per visitor (RPV): here are the five video commerce KPIs worth tracking, with 2026 benchmarks from JOIN and practical ways to turn more views into sales.
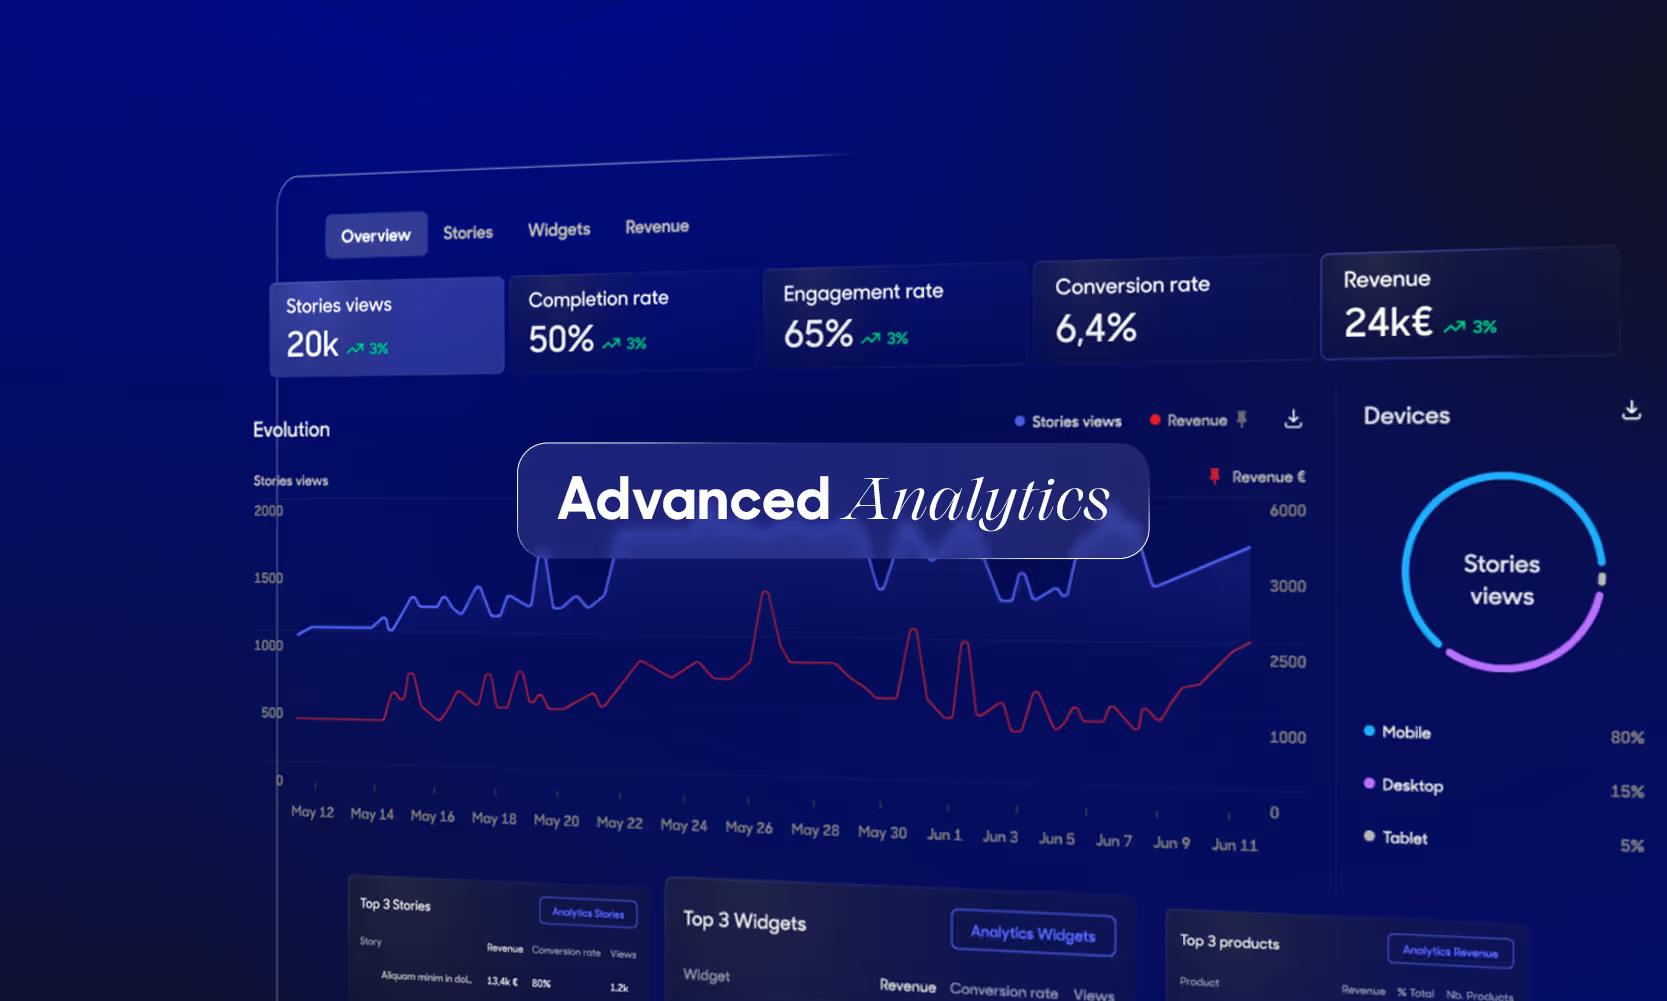
The 5 KPIs to track in video commerce
Source: JOIN, State of Video Commerce 2026.
1. Completion rate: is your content holding attention?
Completion rate tells you how far visitors get through your shoppable videos. It helps you understand whether your content is keeping people engaged or losing them before they reach the product demonstration or key benefit.
The State of Video Commerce 2026 reports an average completion rate of 56.3%, rising to 68.9% among the top 10% of brands.
Note: at JOIN, this metric measures average progress through a Story. For meaningful comparisons, make sure you're looking at videos with similar lengths, formats and use cases.
Where and how the content is viewed can also have a major impact on performance.
→ At Blissim, for example, Stories achieve an 80% completion rate. Customers access them by scanning a QR code in their monthly beauty box, so they're already looking for product information. That’s a very different context from a first-time visitor landing on a product page.
💡 Try this: Cut lengthy intros and show the product in action from the very first second. Then measure how the shorter format affects both completion and sales.
2. Video CTR: are people choosing to watch?
Video CTR measures how effectively your video previews encourage visitors to start watching. It helps you assess the strength of your thumbnails and titles, as well as the visibility of your video placement on the page.
The State of Video Commerce 2026 reports an average CTR of 2.4%, rising to 7.1% for the top 10% of brands. Performance also varies by sector, with an average of 2.8% in Beauty & Cosmetics versus 2.2% in Fashion.
A low CTR can point to an unappealing preview or poor visibility. Before changing the content itself, make sure visitors can actually find it easily.
💡 Try this: Change one variable at a time, such as the thumbnail or placement. For UGC, test a preview that clearly shows the product being used.
3. Add-to-cart rate: is video creating purchase intent?
Add-to-cart rate measures the share of sessions in which at least one product is added to the cart. On a product page, it's a useful signal that video is moving shoppers beyond passive interest towards genuine purchase intent.
According to the State of Video Commerce 2026, adding shoppable video generates an average 3.8% relative uplift in add-to-cart rate, rising to 11.9% among the top 10% of brands.
A strong increase in add-to-carts is a good sign that your video is doing its job. But if add-to-carts rise while completed purchases remain flat, the problem may be further down the funnel. Check shipping costs, stock availability and payment options before blaming the content.
💡 Try this: Find a high-traffic product page with a disappointing conversion rate. Add a short video that tackles the biggest barrier to purchase, whether that's sizing, material or how the product looks in real life. Then track the change in both add-to-carts and sales.
4. Conversion lift: how many additional purchases does video drive?
Conversion lift measures the relative increase in purchase conversion when video is introduced.
Here's a simple example. If 3% of visitors buy on a version of your site with video, compared with 2% on the version without video, the conversion lift is +50%.
There's an important catch, though.
Simply comparing people who watch a video with those who don't can produce misleading results. Video viewers may already be more interested in the product, which means some of their higher conversion rate could be explained by that initial intent rather than the video itself.
A more reliable approach is to randomly split visitors between two otherwise identical versions of your site: one with shoppable video and one without. You can then compare all visitors in each group, including those assigned to the video experience who never actually play a video.
Using this methodology, the State of Video Commerce 2026 found an average 6.1% conversion uplift, rising to 17.7% for the top 10% of brands. Randomisation helps isolate the impact of video by reducing the selection bias associated with visitors' existing purchase intent.
There's also evidence at brand level. Caps Me reported a 20% increase in conversion on its bestselling product following an A/B test that included adding tutorial content to product pages.
💡 Try this: Run a test with and without video on high-traffic product pages, then compare conversion and revenue per visitor once you've collected a meaningful volume of orders.
5. Revenue per visitor: how much value is your traffic generating?
Revenue per visitor, or RPV, measures the average revenue generated by each visitor to your website, whether they make a purchase or not. It's calculated by dividing revenue by unique visitors over the same period.
RPV gives you a broader view than conversion rate alone. Video may persuade more visitors to buy, but it can also help shoppers choose a higher-value product or add complementary items to their order.
The State of Video Commerce 2026 found an average 6.7% uplift in RPV, rising to 21.0% among the top 10% of brands. These figures come from randomised tests comparing experiences with and without video.
💡 Try this: Compare RPV between the two groups in your test to see whether video generates more revenue from the same amount of traffic. Then check whether the additional margin outweighs the cost of your video platform, content creation and ongoing management.
Secondary metrics that help explain performance
Your video analytics dashboard can also track:
- average watch time: 17.8 seconds in JOIN's report;
- completion by content type: 61.2% for tutorials, 59.8% for UGC and 57.0% for product demonstrations;
- session duration: an average uplift of 4.6% in tests;
- widget visibility: useful for distinguishing a content problem from an exposure problem.
These metrics are particularly useful for diagnosing why your core KPIs are moving in one direction or another.
How to measure these KPIs with your video commerce platform
JOIN lets you track the main KPIs for your shoppable videos directly, including views, completion rate, clicks and attributed revenue. To make sure the data is reliable, start by checking that your conversion tracking is configured correctly.
Next, combine JOIN data with data from your ecommerce platform and web analytics solution, such as Google Analytics. This lets you connect video interactions with orders, refunds and traffic sources.
Last-click attribution doesn't always tell the full story when you're trying to measure video's impact on sales. A visitor might watch a video and then return to buy later, for example. JOIN therefore supports multiple attribution scenarios following a click or video view.
Finally, if you want to distinguish revenue that's simply attributed to video from revenue that was actually generated because of it, use JOIN's built-in A/B testing. A randomised test compares visitors exposed to video with a control group, helping you estimate video's incremental impact on performance.
FAQ: Video Commerce KPIs
How do you measure video completion rates on Shopify or PrestaShop?
Use the analytics provided by your video commerce platform. For example, JOIN integrates natively with Shopify and PrestaShop and automatically measures viewers’ average progress through Stories.
When comparing your performance with other tools or benchmarks, make sure the calculation method is the same: average progress through the video or the percentage of videos watched to completion.
What is a good conversion rate for shoppable video?
There is no universal benchmark: performance varies depending on the industry, product, traffic, and video placement.
As a reference, JOIN’s State of Video Commerce 2026 found an average +6.1% conversion rate uplift among visitors exposed to shoppable videos compared with the control group. This uplift reaches +17.7% for the top 10% of brands.
Should you add videos to every product page?
Not necessarily. Start with products that generate enough traffic to measure results and those where video can help overcome a key purchase barrier, such as size, material, usage, real-life appearance, or product benefits.
You can then gradually expand video coverage across your catalog based on the performance you observe.
Can shoppable video slow down your e-commerce website?
It depends on the technology and integration method used. A video commerce solution should allow you to display videos without significantly affecting website performance or page load times.
How do you measure the ROI of shoppable video?
Whenever possible, use an A/B test comparing experiences with and without video to measure its incremental impact on conversion rate, add-to-cart rate, and revenue per visitor.
Then compare the additional revenue generated with the total cost of your video commerce strategy, including the platform, content creation, and management. This helps distinguish revenue simply attributed to video from revenue actually generated because of it.
UGC, tutorials, or product demos: which videos convert best?
There is no single video format that consistently drives the most sales. However, JOIN data shows differences in engagement: tutorials achieve a 61.2% completion rate, compared with 59.8% for UGC and 57.0% for product demos.
Choose the format based on the purchase barrier you want to address: UGC to help shoppers picture themselves using the product, tutorials to explain how it works, and product demos to show the product in action.
{{cta}}