UGC video in ecommerce: what the 2026 conversion data tells us
How much difference do UGC videos make to an online store’s conversion rate? The data offers a way to explore how they hold shoppers’ attention, help them choose a product and support the purchase journey.
JOIN’s State of Video Commerce 2026, covering more than 350 ecommerce brands, provides benchmarks across these stages.
This article looks at the key findings, their limitations and what they mean for the content you choose, where you place it and how you measure results.
How much can shoppable video increase conversion rates?
Before we look specifically at UGC, let’s start with the business impact of shoppable video.
The top 10% threshold is the 90th percentile for the metric in question.
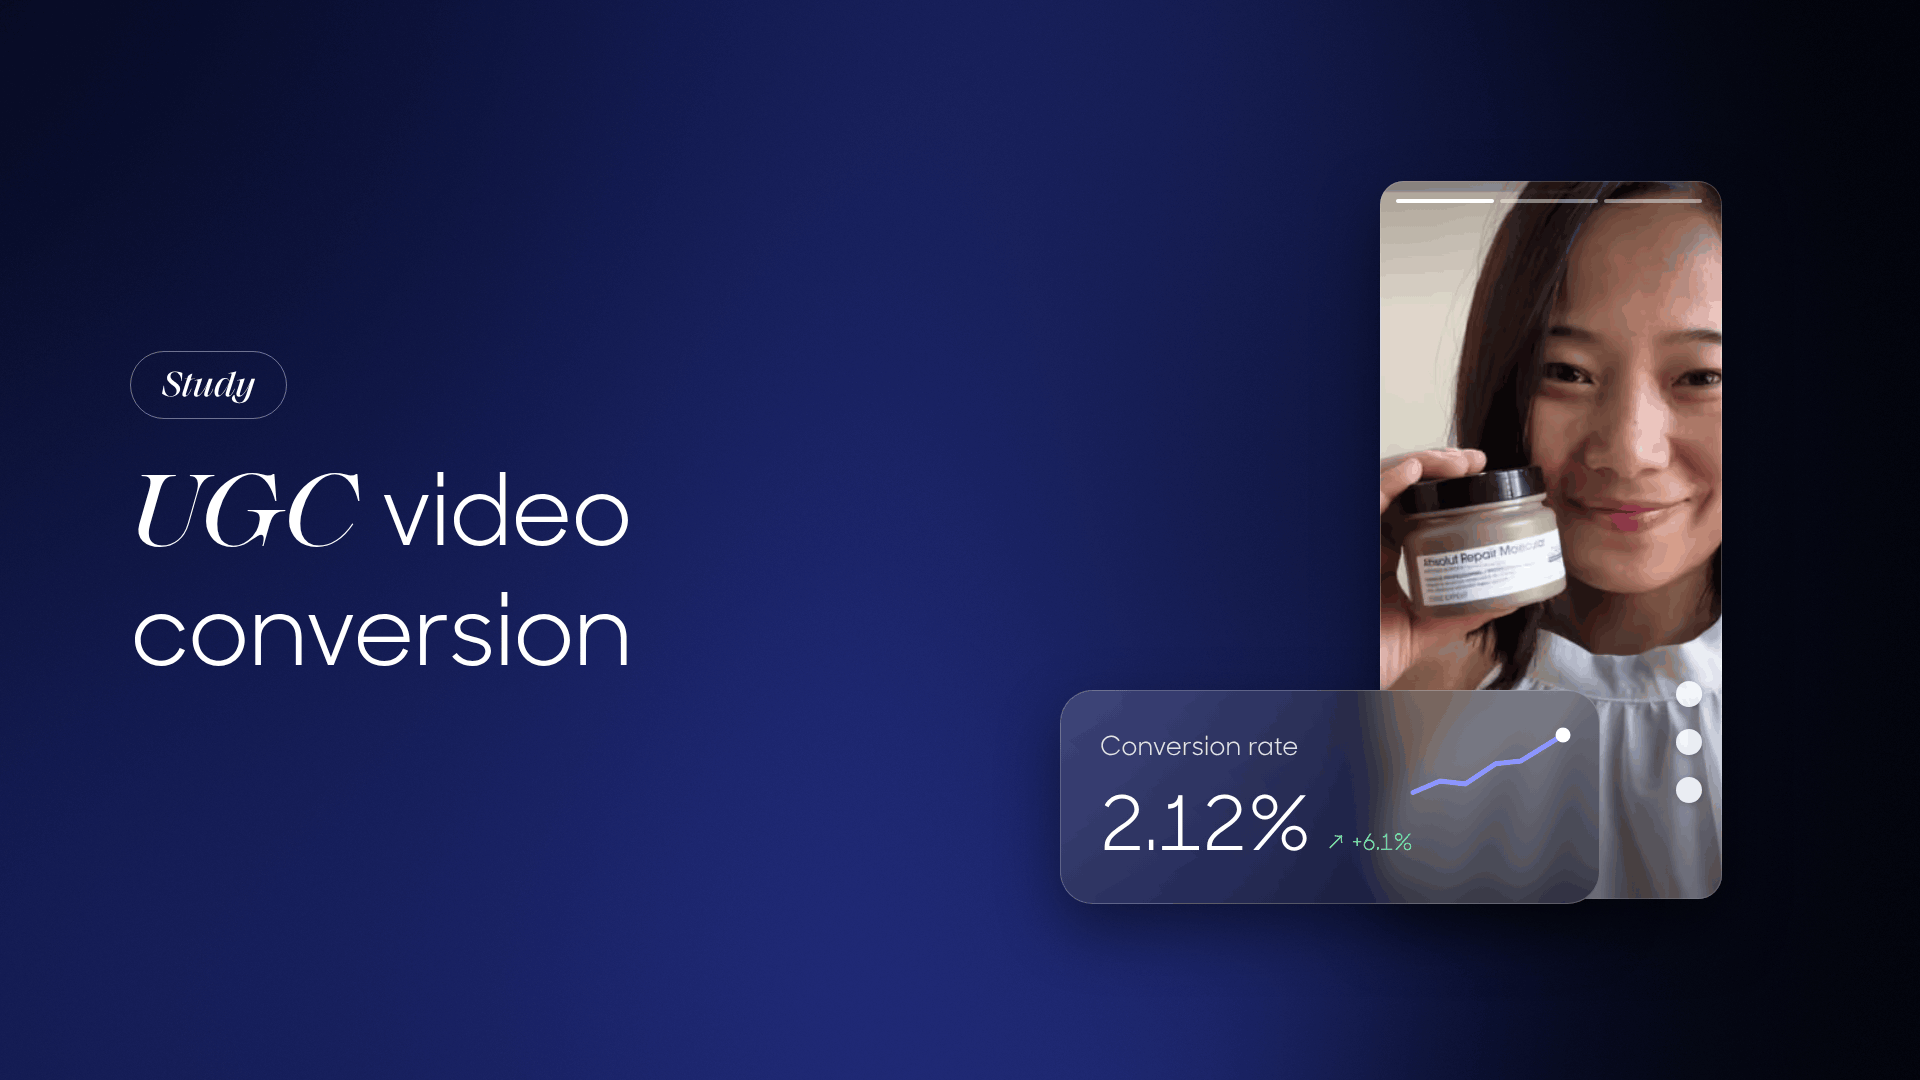
These figures cover all shoppable content, not just UGC. They come from tests in which visitors were randomly assigned to an experience with JOIN or a control group without it. All visitors were included, whether or not they watched a video.
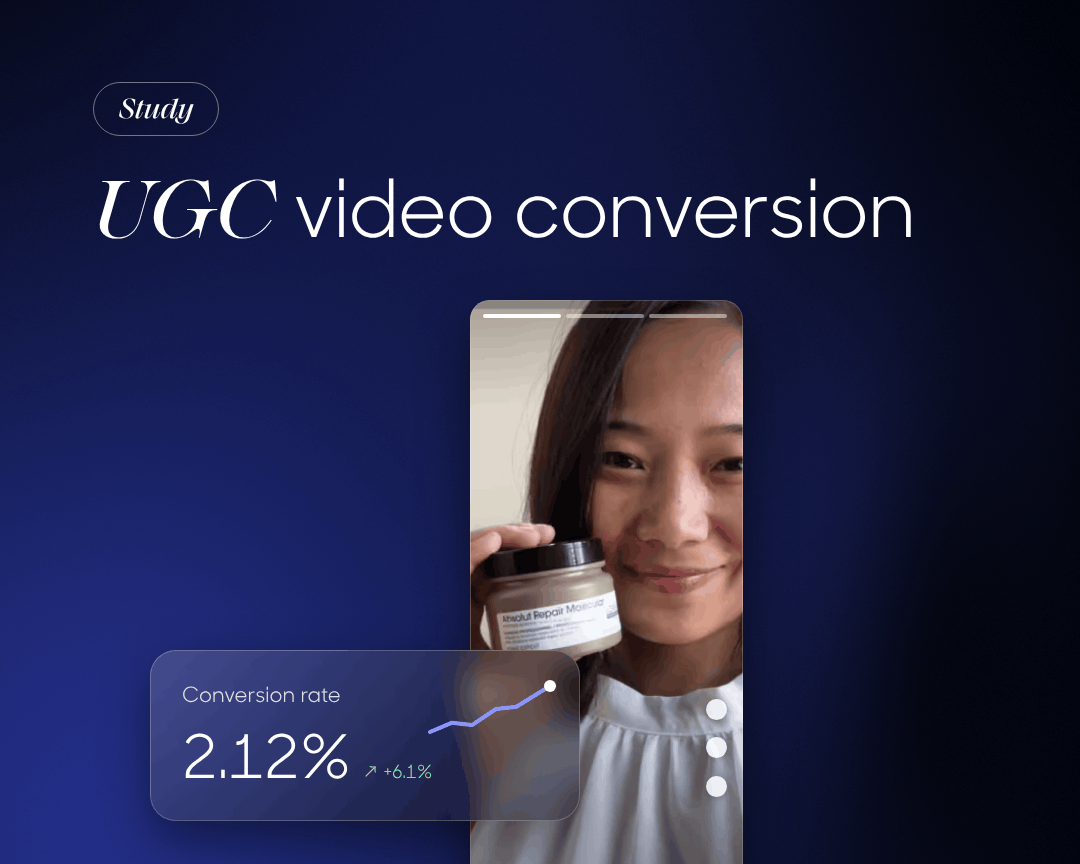
What does a 6.1% conversion uplift actually mean? If your starting conversion rate is 2%, that relative increase takes it to 2.122%. Across 100,000 comparable visitors, that would mean 2,122 orders instead of 2,000: an extra 122 orders, not six extra sales per 100 visitors.
It also matters who you’re comparing. In its 2026 report covering 315 brands, Flowbox reports that UGC-assisted visitors converted at 4.1 times the rate at retailer ScS. Those visitors may already have been more interested in the products. To measure the uplift from adding video, prioritise tests that randomly assign visitors to groups with and without it.
UGC, tutorials or product demos: which content fits the shopper’s needs?
JOIN’s report compares content types using two metrics: average progress through the story and average watch time.
Source: JOIN, State of Video Commerce 2026.
Viewers progress almost as far through UGC stories as they do through tutorials, and further than they do through brand films. Tutorials have the longest average watch time.
To choose a format, start with the shopper’s question. A customer video can show how a garment fits different body shapes. A tutorial can walk someone through adjusting a device. A product demo can quickly show how a mechanism works or what the finished result looks like.
These figures measure attention; they don’t establish which format converts best in every situation. And in JOIN’s reporting, 59.8% completion means average progress through the story. It isn’t the percentage of viewers who watch to the end
Where should you place UGC videos to help shoppers choose?
Product pages are a practical place to start. You know which product someone is considering, so you can choose a video that addresses a specific reason they might hesitate.
Let that question guide placement:
- Next to the size selector: show the fit or how the garment looks when worn.
- In the product gallery: highlight a material, texture or detail.
- Alongside usage instructions: demonstrate a step or show the result.
At Emma, a 14-day A/B test with UGC stories on product pages measured a 19% conversion uplift for bed linen on mobile. The videos showed details such as the products’ texture.
Start with three product pages that get plenty of traffic and have a clear purchase question to address. On category pages, test videos that help shoppers compare products. On the homepage, use content that helps them discover the range. In those placements, measure clicks through to products as well as immediate sales.
Où placer vos vidéos UGC pour aider les visiteurs à choisir ?
La fiche produit constitue un point de départ pratique : vous connaissez la référence consultée et pouvez sélectionner une vidéo UGC avec le produit correspondant.
Le choix de l’emplacement suit cette logique :
- Près du sélecteur de taille : montrer la coupe ou le vêtement porté.
- Dans la galerie produit : présenter une matière, une texture ou un détail.
- Près des explications d’utilisation : montrer une manipulation ou un résultat.
Chez Emma, un test A/B de 14 jours avec des stories UGC sur les pages produit a mesuré +19 % de conversion sur le linge de lit, sur mobile. Les vidéos montraient notamment la texture des produits.
Pour démarrer, sélectionnez trois fiches avec un fort trafic et une question d’achat identifiable. Sur les pages catégorie, testez des vidéos aidant à comparer les références ; sur les pages d'accueil, préférez des contenus facilitant la découverte. Mesurez alors le clic vers les produits autant que la vente immédiate.
Adding UGC videos as shoppable videos to your website is easy. Follow the step-by-step process in our practical guide.
Keep the path to purchase clear on mobile
Mobile accounts for 77.3% of the widget loads observed by JOIN. That makes smartphones the first place to check how your videos work on the page. join-stories.com
Vertical video can make content easier to view on a small screen. Above all, check that the product stays visible, subtitles are easy to read and the video makes sense without sound.
Then follow the journey through to the basket. Is the player easy to close? Can the shopper get back to the right product variant? Does the widget cover a button?
Even a convincing video won’t help much if it gets in the way of choosing a size.
Check loading performance and the desktop experience too. Mobile should come first in your checks, while the buying journey needs to work on every screen.
How does UGC video performance vary by industry?
Results differ across categories. The table below shows average uplifts for shoppable video, across all content types.
Source: JOIN, State of Video Commerce 2026. These sectors had the largest usable samples.
Use these benchmarks to guide your tests. In beauty, for example, it may help to show how a product looks when applied. For fashion, focus on fabrics and how a garment moves. For a fitness accessory, explain how to use it.
Differences between sectors don’t establish which content drove the uplift. They give you context for your own results as you work out what resonates with your shoppers.
Three ways to get more from your UGC videos
1. Expand coverage, starting with the pages where video can help
Before adding more videos to a single product page, look at how many visitors have a chance to see your content.
Start with a few pages that get plenty of traffic, then gradually roll out the approaches that work. The sources reviewed don’t establish a universal minimum of three or five videos per product. Each additional video should give shoppers useful information.
2. Make videos easy to find at the right moment
Test the same content in two placements. Track the widget open rate, then add-to-cart rates and purchases.
A preview that clearly shows the product, paired with a title that tells shoppers what they’ll learn, gives them a reason to watch. Keep product information and the buy button easy to access.
3. Choose videos that address purchase hesitations
Give each video a question to answer: which size should I choose? What’s in the box? How do I use it? What results can I expect to see?
An unboxing can show what’s included. A video of the product in use can show what happens next. How useful each one is depends on what the shopper wants to know.
To measure results, choose your main KPI before launching and, where possible, run an A/B test with and without UGC. Engagement metrics can then help explain the outcome: do visitors see the widget, open it and continue towards a purchase?
Finally, to assess profitability, compare the estimated additional margin with your platform, content and management costs.
FAQ: UGC video and ecommerce conversions
Does UGC convert better than professionally produced video?
JOIN’s data shows differences in engagement, but doesn’t establish that one consistently converts better than the other. Compare content that answers the same purchase question.
What’s a good completion rate for a UGC video?
JOIN’s benchmark is 59.8% average progress through the story. Compare content with similar lengths and structures, using the same calculation method.
How many UGC videos do you need per product page?
The sources reviewed don’t establish a universal minimum. Start by answering shoppers’ main questions, then measure whether adding more content helps.
Can UGC work for technical products?
It can show the product in real-world use. Add tutorials when installation or operation needs more explanation.
How can I get more people to click on my videos?
Test the preview, title and placement, changing one variable at a time. Check whether more clicks also lead to more purchases.
Can UGC videos replace product photos?
Keep the photos shoppers need to examine details and product variants. UGC adds another perspective by showing the product in use.